TABLE OF CONTENTS
- Overview
- Create a report
- Design the layout of the report
- Apply filters to a report
- Use report and chart templates to build a report
- Save changes to a report
- Export data
- Present a report
Overview
With Freshworks Analytics, the goal is to give you the power to make your own decisions with respect to your key performance indicators. Using reports, you can decide which metrics to track, how they're organized and what filters you use. You can choose which visualisations you'd like, compare metrics and apply even report-level filters to organize your datasets.
Create a report
When it comes to creating a new report, there are two options: cloning a curated/existing report or creating a new report from scratch.
Clone a curated/existing report
A curated report is a report built for you by the Freshworks product team. We put together a group of metrics to give you an overview of your account. You can modify a curated report by cloning it.
Log in to the Freshservice application.
Go to Reporting > Analytics.
Open the report you'd like to clone.
Click on its name. A dropdown menu will appear with an option - clone the report.
Clone the report so you can make changes at will.
Create a new report
Click on the 'New Report' button. You'll be asked to enter a name (you can change it later) and choose its access permissions (this cannot be changed later). If you'd like to change access permissions for a report later, you have to clone it and save the cloned report with the new access permissions.
Once you create a new report, you will be able to add widgets to the report. You can choose to: start from scratch with a new chart, a chart created by your team in the 'Existing' gallery or a template created by the Freshworks product team. You can also add a text widget to the report.
Here's how you can modify widgets
Design the layout of the report

A report consists of widgets. You can add chart and text widgets to a report and categorise them using pages. You can add style to a report's elements - background color, border, change font etc.
You can create up to 10 pages of widgets in a report so use it wisely.
Apply filters to a report
In Freshworks Analytics users can employ four levels of filters to refine reports and their components:
Report-level filter

Page-level filter

Widget-level filter

Metric-level filter

Date range and date range dimension

At both the report and page levels, users have the option to incorporate date ranges, which apply to the entirety of the report or the specific page, respectively. A date range functions as a filter that influences the data retrieved within those specified periods.


Additionally, users can utilize the "Apply to all metrics in this report" checkbox available within the report-level date range. This feature ensures the application of the report-level date filter to the entire report down till the metrics. You will notice the default Date Range Dimension filter automatically enabled across all metrics in the report when this checkbox is selected. In this example, the Date Range Dimension is mapped to the Created Date. This is configurable and can be replaced with any other date fields as well.
Time zones configuration for reports
You can now configure time zones for reports to bring localized clarity to your global data. Previously, reports were locked to a single, pre-defined time zone, often requiring users to perform manual calculations to align metrics with their local business hours. You can now adjust time zones for individual reports. Whether you are a marketing manager in London tracking GMT traffic or a sales rep in California syncing PST performance to your daily schedule, your report will speak a common language.
This ensures accurate analysis and seamless global collaboration by automatically adjusting all timestamps and date ranges without altering the underlying data integrity. By selecting your preferred time zone via the new user interface dropdown, the presentation shifts instantly to provide consistent time references for your entire team, and eliminates the risk of misinterpretation during cross-border meetings empowering geographically dispersed teams to make faster, more informed decisions based on a shared understanding of key metrics.

New Subtotal and Grand Total table aggregations
Subtotal and Grand Total aggregations have been introduced for Summary and Matrix Tables in reports with two Group Bys. With this enhancement, you can now visualize multiple levels of summary data simultaneously.
Subtotal: Aggregates metrics for individual groups.
Grand Total: Provides a comprehensive calculation across all detailed report data.
Note: Subtotals only apply in the Summary and Matrix Tables when there are two Group Bys.
Example: Summary Table data for Customer Reply Count grouped by Status and Impact
The following sample illustrates an example of Customer Reply Count metric (sum) grouped by ‘Status’ and ‘Impact’ in the last 90 days, which shows you the Subtotal for individual groups along with the Grand Total.

Configurable Start Day for reports
You can now customize the start day of the week for individual reports. With this enhancement, you can now support global teams by allowing users to choose between Sunday, Monday, or other days to align with local workdays and regional standards.

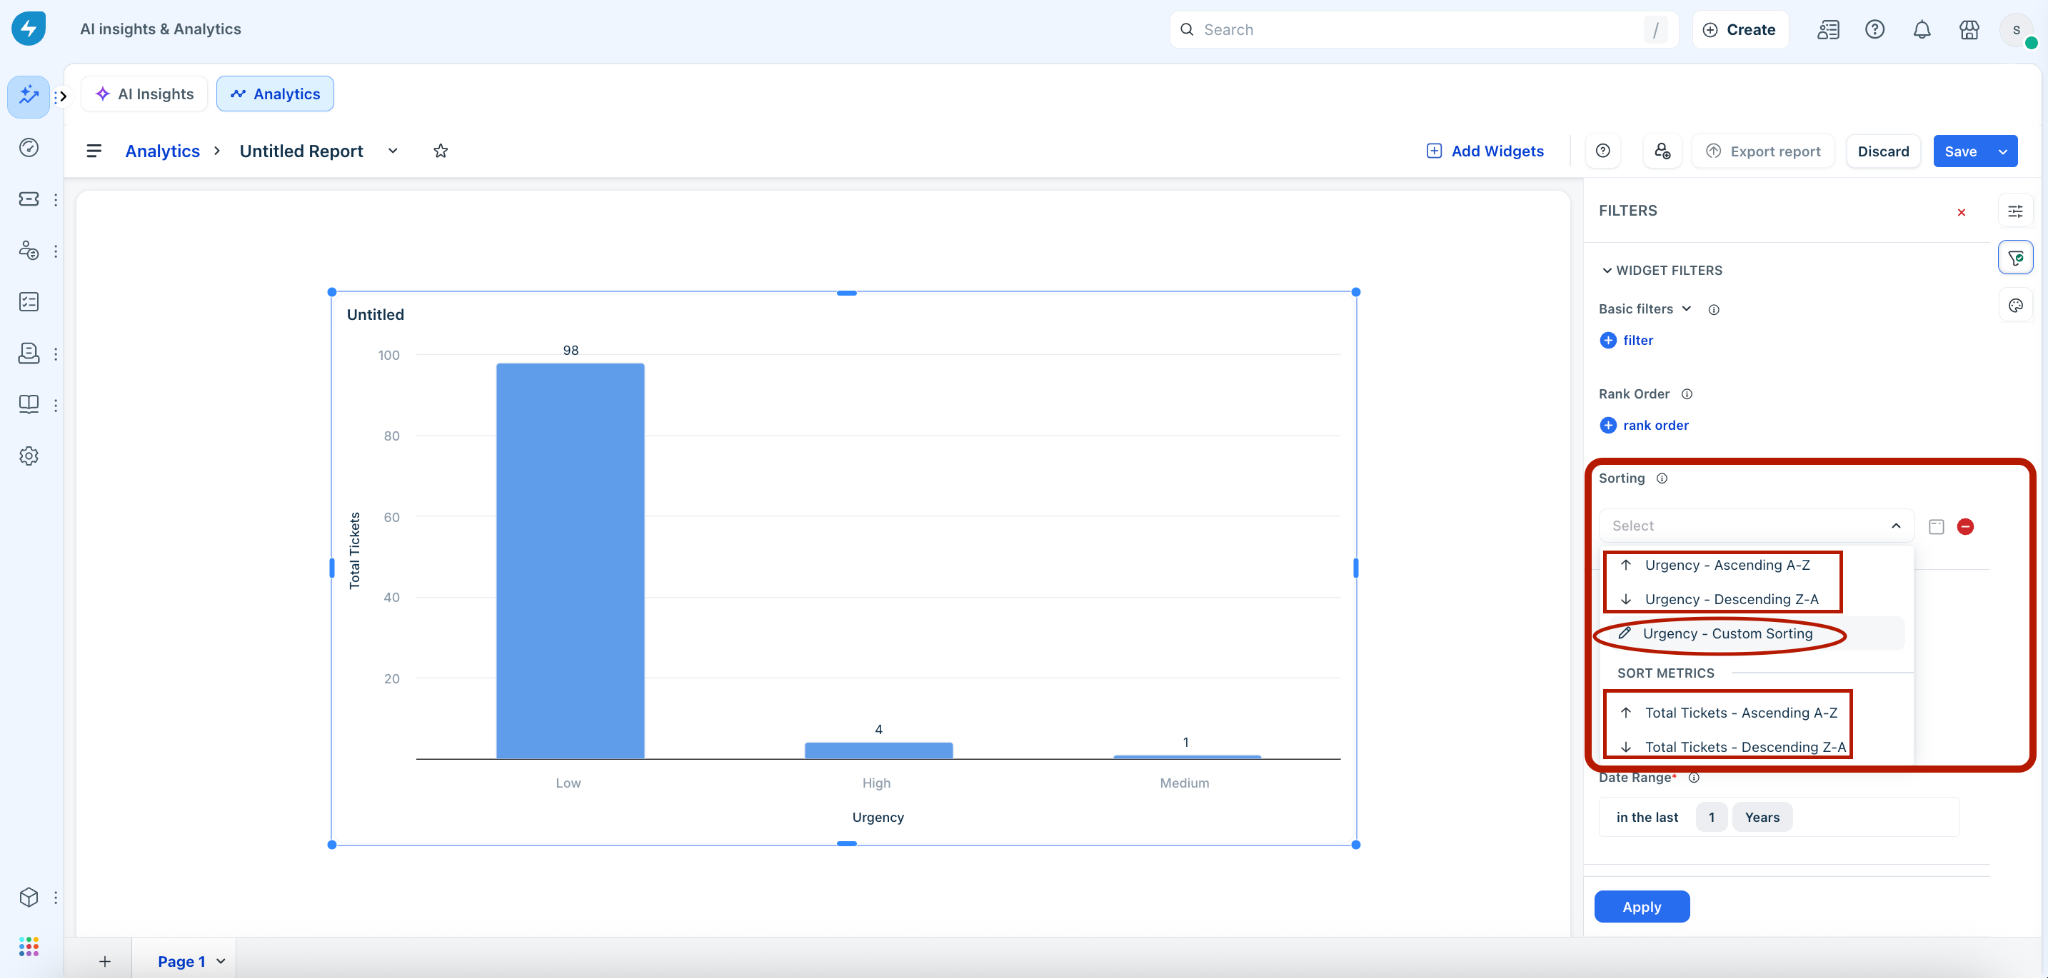
Advanced sorting options
This feature empowers users with enhanced capability to sort reporting data across various axes to meet custom analytics goals.
Key features
Basic sorting: Ability to perform basic sorting of metrics and group-by values (supported across both X-axis attributes and Y-axis metrics).
Customized sorting: Users can perform customized sorting for specific metrics and group-by values to modify the placement of specific data points/bars in a chart manually.
Important details and requirements
Language restriction: Customized sorting functionality is supported for English language customers only. Basic sorting remains available for all users.
Support:
Applies to both X-axis attributes (for example, Urgency) and Y-axis metrics (for example, Total Tickets).
Supports both Ascending (A-Z) or Descending (Z-A) alphabetical/numerical format.
Use report and chart templates to build a report
You can now also use pre-configured reports and chart templates that simplify navigation, allowing you to quickly create professional, visually engaging reports using pre-configured layouts.
Build with report templates
Log in to the Freshservice application.
Go to Reporting > Analytics.
Click the New Report dropdown and select From Report Templates.

Click any report template thumbnail to preview the data (for example, Journey Requests Overview).

Then, click Use Report Template.

The report will be cloned and displayed.

You can now set more report configurations, filters, style, add widgets, and save the report.
Build with chart templates
Log in to the Freshservice application.
Go to Reporting > Analytics.
Click New Report.

Then, click Use a chart template.

In the Chart Templates dialog, click any specific category on the left pane (for example, Tickets).
Click any chart template thumbnail to preview the data.
Or, select the required chart template.
Note: You can select multiple templates.

Click Add to Report.
The selected widgets will be added to the new report.

You can now set more report configurations, filters, style, add more widgets, and save the report.
Save changes to a report
When you modify the filters for a widget or a report, you need to hit 'Apply' for the changes to be reflected in the report/widget.
Once you apply your changes to a widget, you have the option to save the modifications to the widget, save the modifications as a new widget and add it to another report or the current one, or discard the changes. Similarly, when you modify a report, you have the option to save changes or discard them.
Export data
You can set up schedules to regularly export certain datasets and email reports to your and certain stakeholders' inbox.
Find out more about exporting data from Freshworks Analytics
Present a report
The presentation mode for a report removes all the distracting details - the navigation bar, the filters buttons etc. - from the screen and give data the spotlight it deserves.

Take me to the Freshdesk, Freshservice, Freshsales, Freshcaller, Freshrelease and Freshteam support portals.